Fintech Analytics Dashboard
Real-Time Financial Dashboard UI
Technologies Utilized
Project Overview
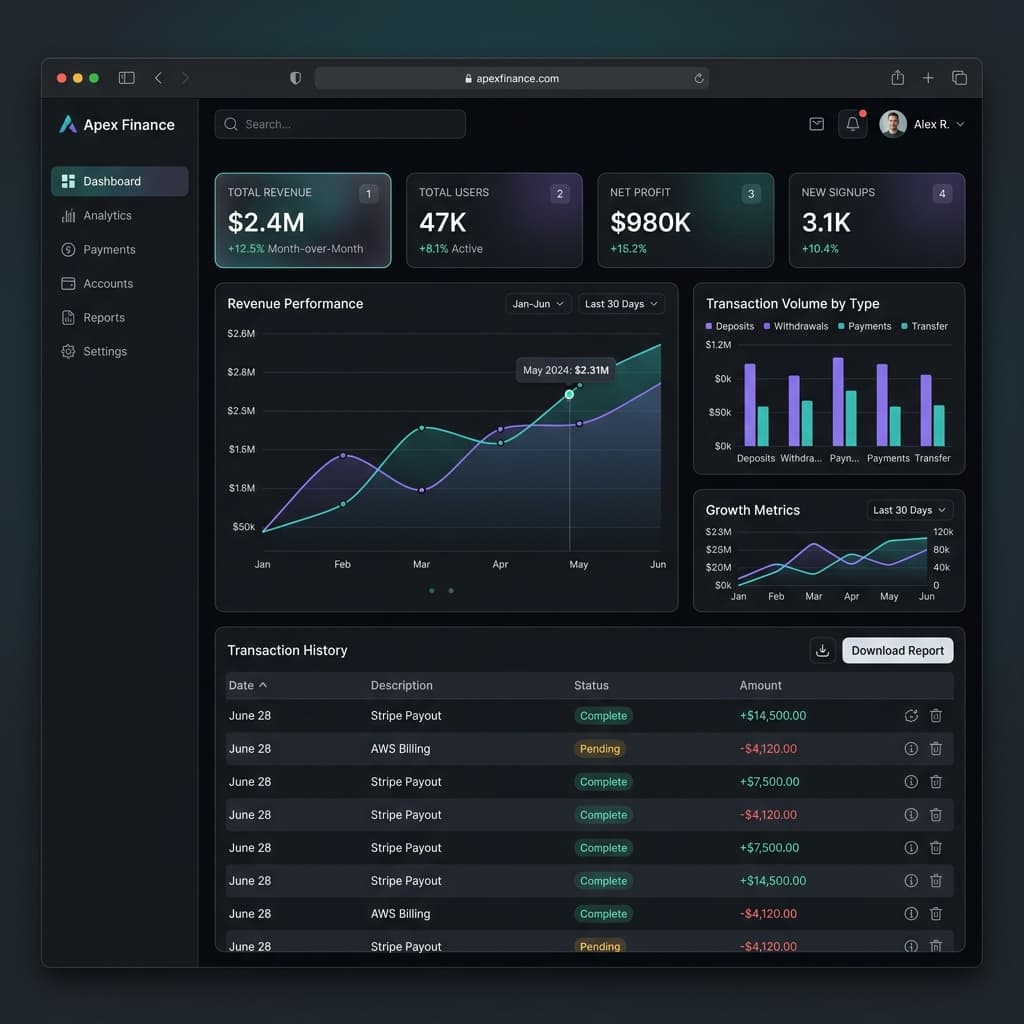
A comprehensive SaaS dashboard UI for monitoring transactional volume, recurring revenue metrics, customer cohorts, and liquidity reserves in real time.
The Problem
Business founders often struggle with cluttered analytics panels where crucial revenue indicators are buried behind confusing navigation and unresponsive data charts.
The Solution
Crafted an editorial, dark-themed dashboard layout highlighting primary KPIs (MRR, churn, runway) at the top, accompanied by responsive SVG charts and filterable transaction ledgers.
Key Features & Architecture Highlights
- Interactive revenue trajectory and volume charts powered by Recharts
- Filterable ledger table with search, status badges, and transaction sorting
- Modular widget grid allowing flexible reorganization of metric cards
- Consistent dark-mode aesthetic preventing eye fatigue during extended analytical sessions
Engineering Challenges
Rendering dynamic time-series charts with hundreds of data points without blocking scroll performance.
Implementation Strategy
Employed virtualized row rendering for large transaction lists and memoized chart SVG components.
Have a similar project in mind?
Let's evaluate your requirements, map out the tech stack, and deliver a production-ready application.